

Add bar graphs to your angular application (Using ngx-charts).
Learn how to add bar graphs to your angular application using free and easy to use ngx-charts library.


Bar graphs are very useful and important when we want to display some financial data for a period of time. For example, if we want to display revenue or sales of a company for last 5 years then bar graphs are best choices to display such data. This article covers on how you can integrate and dynamically generate bar graphs on your angular website. So, let's get started-
Dependency versions used-
Angular: v17.1.0
ngx-charts: v20.5.0
Node: v20.9.0
NPM: v10.1.0
Step 1: Generate & launch a new Angular application.
We'll be using Angular version 17 in this article. use the command below to create a new project using Angular.
ng new bar-graph-app
Use the command below to launch the application.
ng serve --live-reload --open
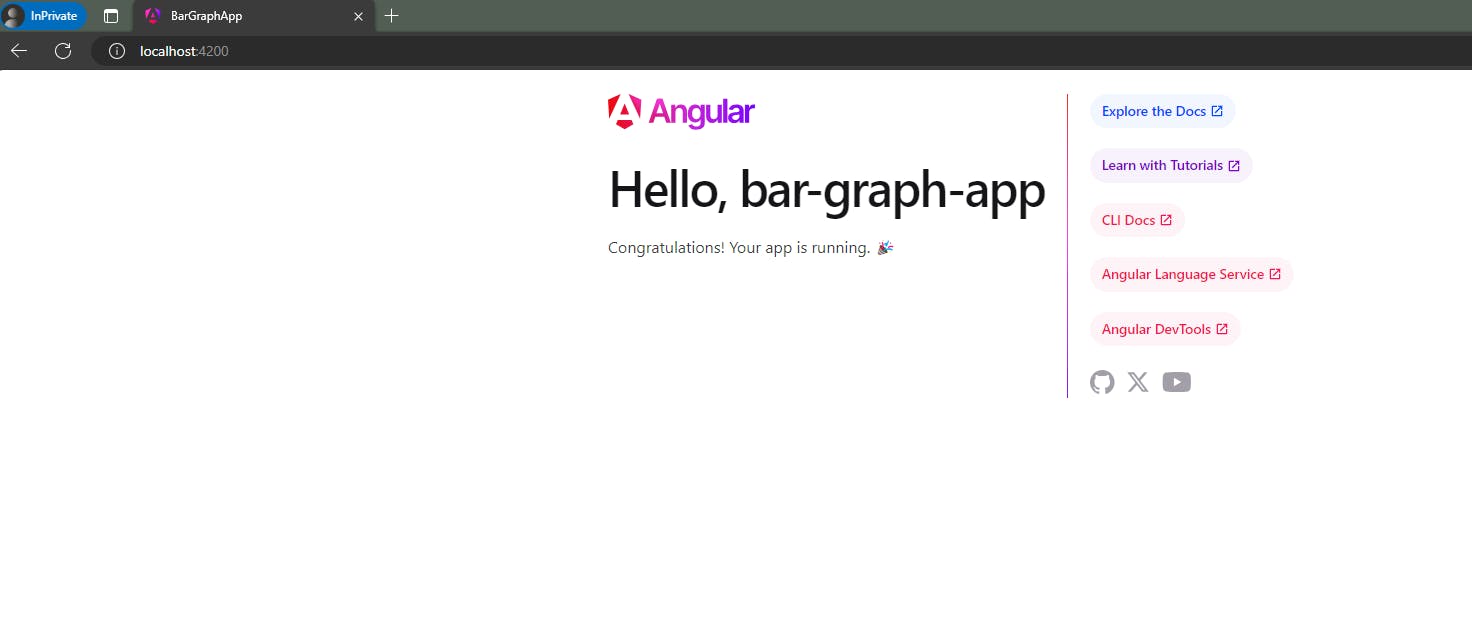
You should get this type of screen when you launch the app in browser.
Depending upon the Angular version, your initial home screen could be different from below. Let it be, it's normal.
Step 2: Install ngx-charts library to application.
We'll be using ngx-charts library in this article. This is free to use and provides a wide coverage of chartings and graphs to use freely. You can learn more about this library here and get demo on various charts and graphs here. Use the command below to install & add the library to your Angular application.
npm i @swimlane/ngx-charts --save
After installing the above library, we need to add this in our components import array. Use the code below to import the NgxChartsModule library in imports array in app.component.ts
If you want to add graphs at multiple places in your application, then you can skip the above step and import the module library globally as well in
app.module.ts
import { Component } from '@angular/core';
import { RouterOutlet } from '@angular/router';
import { NgxChartsModule } from '@swimlane/ngx-charts';

@Component({
  selector: 'app-root',
  standalone: true,
  imports: [RouterOutlet, NgxChartsModule],
  templateUrl: './app.component.html',
  styleUrl: './app.component.css'
})
export class AppComponent {
  title = 'bar-graph-app';
}
Step 3: Update HTML code with ngx-charts-bar-vertical tag.
In this article, we will be generating and displaying the vertical bar-graph. To display bar-graph, we need to use HTML tag <ngx-charts-bar-vertical></ngx-charts-bar-vertical>. The syntax is given below. Use the below tag in your app.component.html file.
<h2>Bar Graph Chart Demo</h2>
<hr/>

<ngx-charts-bar-vertical
  [view]="view"
  [results]="graphData"
  [xAxis]=true
  [yAxis]=true
  [legend]=true
  [showXAxisLabel]=true
  [showYAxisLabel]=true
  [xAxisLabel]="xAxisLabel"
  [yAxisLabel]="yAxisLabel">
</ngx-charts-bar-vertical>
Let's discuss on each property being used in above HTML tag in detail-
view (Optional) - This is used to draw the graph is custom defined height & width. This accepts the two-integer element array with first element as Width & second element as Height.
result (Mandatory) - This is used to provide data to library to show in graphs. This accepts the arrays of json data which consists of x and y axis avlues.
xAxis & yAxis (Optional) - If set to
true, these will show the X-Axis & Y-Axis values for each data.legend (Optional) - If set to
true, this will show the information about data points on top-right of graph.showXAxisLabel & showYAxisLabel (Optional) - If set to
true, these will show the X-Axis labels & Y-Axis labels.xAxisLabel (Optional) - This is used to display the X-Axis label on bar-graph. This will work only when showXAxisLabel is set as
true.yAxisLabel (Optional) - This is used to display the Y-Axis label on bar-graph. This will work only when showYAxisLabel is set as
true.
Step 4: Update TS code to generate bar graph.
As we have added the HTML code. Now, it's time to add the TS code and finalize the bar graph to display it on UI. Copy and paste the below code in your app.component.ts file.
import { Component } from '@angular/core';
import { RouterOutlet } from '@angular/router';
import { NgxChartsModule } from '@swimlane/ngx-charts';
@Component({
selector: 'app-root',
standalone: true,
imports: [RouterOutlet, NgxChartsModule],
templateUrl: './app.component.html',
styleUrl: './app.component.css'
})
export class AppComponent {
//view : To define the display dimensions
view: [number, number] = [700, 400];
// xAxisLabel : X-Axis Label
xAxisLabel = 'Financial Year';
// yAxisLabel : Y-Axis Label
yAxisLabel = 'Revenue (In Cr.)';
//graphData : Array of JSON data having "name" as parameter to
//display on X-axis and "value" as parameter to display on Y-axis
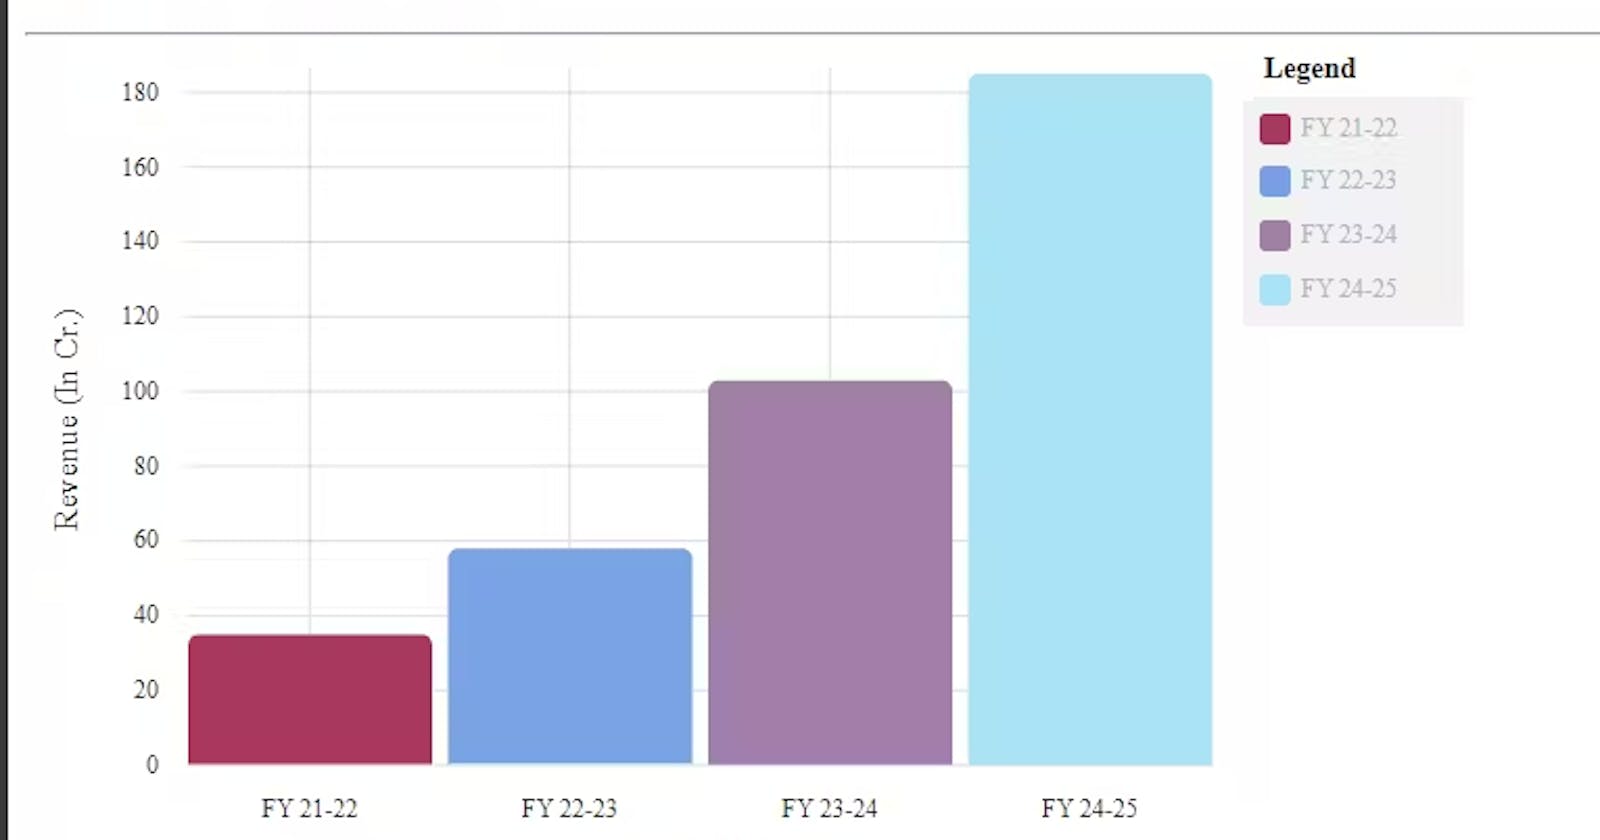
graphData = [
{
"name": "FY 21-22",
"value": 35
},
{
"name": "FY 22-23",
"value": 58
},
{
"name": "FY 23-24",
"value": 103
},
{
"name": "FY 24-25",
"value": 185
}
];
}
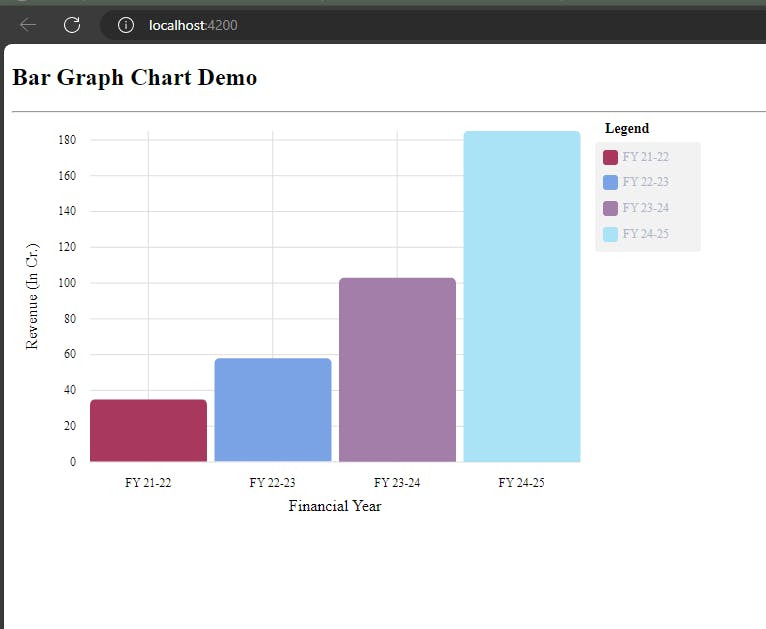
After adding the above, we will have the graph generated on browser as below.
Conclusion
Did you see? Adding bar graph to your angular website is as simple as that. You can also change the default colouring of data bars by providing colour schemes to [scheme] property in HTML tag. Feel free to drop an email on official@byteshub.in to request article on any choice of yours. Connect with me on my LinkedIn Rohan Sanger for collaboration/feedback.